
HAR files and Network Requests
HAR is a short form of HTTP Archive format, which tracks all the logging of a web browsers interaction with a site. The file contains HTTP response and request headers.
HAR files can be used to troubleshoot issues specifically for the following problems:
- Performance Issue: Slow page load, a timeout when performing a task.
- Page rendering: incorrect page format.
Tools
Simple service for generating different HTTP codes - https://httpstat.us/
HTTP response status codes - https://developer.mozilla.org/en-US/docs/Web/HTTP/Status
HAR Analyzer - https://toolbox.googleapps.com/apps/har_analyzer/
How to Generate a Har File
Using the following sample application (platform seed) as an example:
openfin -l -c https://openfin.github.io/platform-api-project-seed/public.json
-
After launching the application, right-click inspect to bring up Developer Tools.
- Navigate to the Network tab
- Look for the round Record button (
 ) in the upper left corner of the tab, and make sure it is red. If it is grey, click it once to start recording.
 - Check the box Preserve log.
- Click the Clear button (
 ) to clear any existing logs from the Network tab.
 - With the sample application launched with the default chart window, navigate over to the Network tab and click Cmd + R / Ctrl + R to refresh the platform window. You should see all the requests/responses for the platform window.

- Navigate to the download icon(
 ) that will export the har file to your preferred location (shown in the animation below)
You can reproduce a network issue specific to your application at step 6.
Analyzing a Har File
There are plenty of tools available that you could use to analyze a har file. In this example I have used the following resource provided by google: https://toolbox.googleapps.com/apps/har_analyzer/.
1. To analyze the har file, upload the har file from your saved location.
2. After uploading the har file, the network activity will be displayed with all requests/responses as shown below: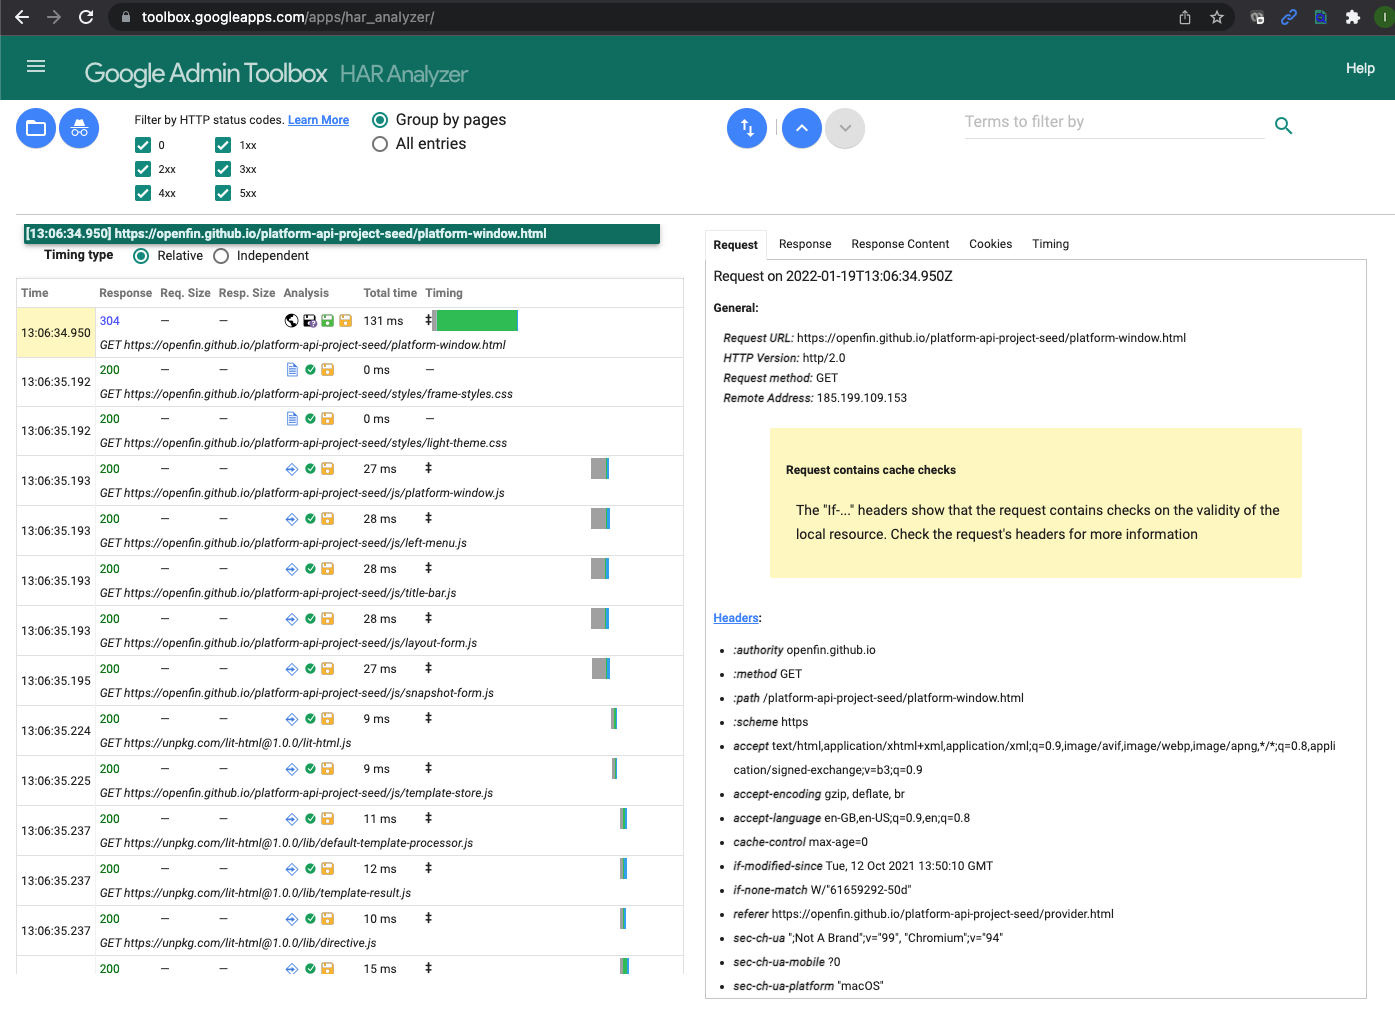
3. You can filter responses by HTTP status codes, as shown here:
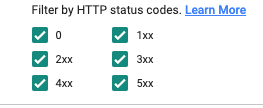
- Informational responses (
100–199) - Successful responses (
200–299) - Redirection messages (
300–399) - Client error responses (
400–499) - Server error responses (
500–599)
4. You can then dig deeper into the request/response by navigating to the following section:
Potential Issues to look out for in the har file
Usual things to pay attention to when analyzing a HAR file include resources not being cached, resources with the longest load time, and long DNS lookup times.
- DNS Lookups. DNS lookup times can vary greatly among ISPs, geographic locations, and DNS managers. Nevertheless, if you have many resources being loaded from third-party websites, this can increase the DNS lookup time for these resources thus decreasing the overall speed. If this is an issue, the client should consider moving items to their server or CDN rather than loading from third parties.
- Longest load time items. The page items with the longest load time of the largest potential for speeding up your load time. The plan of action for speeding up an object will be determined by its nature. Load time of static files may be reduced through aggregation, compression, and judicious elimination of unutilized elements.
- Items not being cached. If you reload your web page, your static objects should not be reloaded. Doing this will have an effect on page loading time as the browser must solicit all of the same resources every time the user revisits the page.
Comments
0 comments
Please sign in to leave a comment.